Interactive wind map online. Global online wind map Online air mass map
Did you know that the wind speed of Hurricane Irma, which dominated the coast of Florida, and because of which millions of people had to be evacuated, was up to 300 km/h. Gusts of such force leave virtually no chance for any residential building. It’s no wonder that many people began to become interested in the wind map and track the movement of the hurricane.
The windy com website provides online the most current data on a wide variety of climate indicators:
- Wind strength and direction (wind map)
- Cloud distribution
- Temperature map
- Precipitation in the form of rain and snow
- Atmosphere pressure
- Strength and direction of wave movement
What’s very nice is that the windy weather website is almost completely translated into Russian, so there are absolutely no questions about where and what is shown, as well as how to enable or disable this or that option.
By clicking on the icon in the form of three longitudinal stripes, you will be taken to the settings, where you can set in which units to display pressure, temperature, set the weak Internet mode, etc.

On the right side of the site window you can turn on/off the display of the desired parameter: temperature, wind, waves, precipitation, etc.
What we can express our deep gratitude to the developers of the resource for is the very high visibility of the data presented.
The Earth map uses animation to show the direction of the wind, its speed and strength. Since all data is displayed in real time, you can see what is currently happening in a particular region of the planet. But that's not all!
At the bottom of the window there is a timeline with dates and days. By clicking on any date, you will receive a weather forecast for that day. And pressing the play button (white triangle) will launch an animation of hourly changes in weather conditions, in which you will see how, for example, the wind will change tomorrow, the day after tomorrow and over the next days:
Without a doubt, Windy provides a great interactive opportunity to see first-hand how the weather is affected by the wind. You don’t need any graphs or tables – you see everything with your own eyes online, in real time!
Here is an example (You can switch the buttons on the right side of the window, change the scale, start animation, etc.:
When you click on the name of a locality, a detailed weather forecast for today and the next five days opens for it:

In addition to everything described above, windy.com has a number of “tricks” that someone will find very useful. For example, displaying the current situation at airports, showing on the map places suitable for hang gliding or kiting, displaying online cameras, etc.
Using only the most up-to-date data available online, Windy not only produces the most accurate map of the world's winds, but also makes reliable weather forecasts. This site is preferred by tens of thousands of users around the world, and its mobile application for Android and iOS is one of the most popular and highly rated:

The global wind map, created by engineer Cameron Becario, allows you to track the movement of winds in almost real time.
The service itself was launched several years ago, to generate a map, Cameron receives data from the National Center for Atmospheric Research and the National Weather Prediction Centers of the United States, but the visualization itself turned out to be much more beautiful and more elaborate than that of the employees of the national organization. The map is known to the general public only because it shows wind directions, but Becario has been working all this time to improve the service and introduced a significant number of innovations.
A menu has appeared at the bottom right of the screen where you can configure various map display parameters. Now the service shows both a wind map and a map of temperature distribution, cloudiness and relative humidity. You can observe the winds on the surface of the Earth or over the oceans, a grid of coordinates and control using keys have appeared.
You can also change the way the map is displayed. Available projection options: Mercator, stereographic, azimuthal and many others. The service can be configured as you wish and enjoy exciting dynamic visualization.
Modern satellite systems make it possible to take photographs of the Earth not only in high resolution, but also in a wide variety of spectra, which allows us to take new steps in studying the influence of weather on the climate of our planet.
In the photo below you can see a snapshot of the Earth's surface, on which a weather model with an error of only 3.5 km is superimposed. This became possible thanks to the work of the GEOS-5 spacecraft, designed to monitor weather and climate conditions on the planet. The models themselves are built by NASA scientists using the agency’s well-known supercomputers, and the data for their construction is regularly transmitted by GEOS.
You can look at the map in full-screen size.
Observing the model, you will notice that the air flows on it are marked in different colors. This is not the temperature, as it might seem at first glance, but the speed of surface winds on our planet. White color means that the wind is relatively weak (up to 40 m/s), and red indicates the strongest currents (up to 175 m/s).
Below you can look at the movement of air currents over the Earth's surface.
Wind movement - view from space
We are all accustomed to the fact that information about upcoming weather, whether on television or the Internet, is accompanied by data on wind speed. However, now everyone can use the new resource to see an interactive map of the movement of winds on our planet.
Online - wind movement map
This innovative tool, created by Japanese engineer Cameron Beccario, allows you to monitor air masses in real time. The system itself processes new data and adapts it to produce an interactive image. The information needed to build the model is provided by the US National Center for Atmospheric Research and the US National Weather Prediction Center.
In addition to regular observation, the map has flexible settings - here you can see how the wind creates sea and ocean waves, and see a model of the spread of air pollution from industrial enterprises. Also, specialists can carefully study the map with filters turned on for the water content in the air masses and in relation to the surface height above sea level.
And finally, if you wish, you can change the projection of the map image at your discretion.
In this material, I will talk about several services that work as an online wind map in real time, and I will explain in detail how to use them. They say nature has no bad weather. However, bad weather outside the window often affects our mood and well-being, changes our plans for the day, forces us to dress warmer, stay indoors more, waiting out the storm raging outside the window. In order not to be caught by surprise, we often turn to the functionality of network services that can not only display the current weather conditions, but also predict its development for the near future.
How to track wind direction on a map online
The Internet now offers several popular services that allow you to track the weather online, check wind speed, temperature, pressure, precipitation, and a number of other relevant indicators. Typically, such sites use data from weather satellites (as well as aggregated data from national hydrometeorological centers). With the help of which interactive weather maps of most corners of our vast planet are formed.

Typically, such services display an image of the globe, which can be rotated in different directions. And, having chosen any of its points, find out about the wind speed available there, the movement of cyclones, temperature, precipitation, and other natural factors.
Let's consider a couple of popular sites for displaying wind maps, with a description of their functionality.
Windy.com - the best online wind map
The history of the world-famous website windy.com dates back to 2014, when the famous Czech millionaire and philanthropist Ivo Lukačovič decided to create an Internet resource that would display a wind map in real time. Calling himself a wind lover, and also regularly practicing flights on helicopters and airplanes, Lukacovich sought to create an easy, fast and convenient resource. Allowing you not only to display the situation with wind speed and direction at any geopoint, but also to show temperature, the presence of clouds and precipitation, pressure, and a number of other relevant parameters.

In the center is the same “millionaire and philanthropist”
This resource, called “Windyty” (later renamed "Windy") makes it possible not only to obtain information about the current weather condition, but also to view the forecast for the near future using the visual component available on the site.
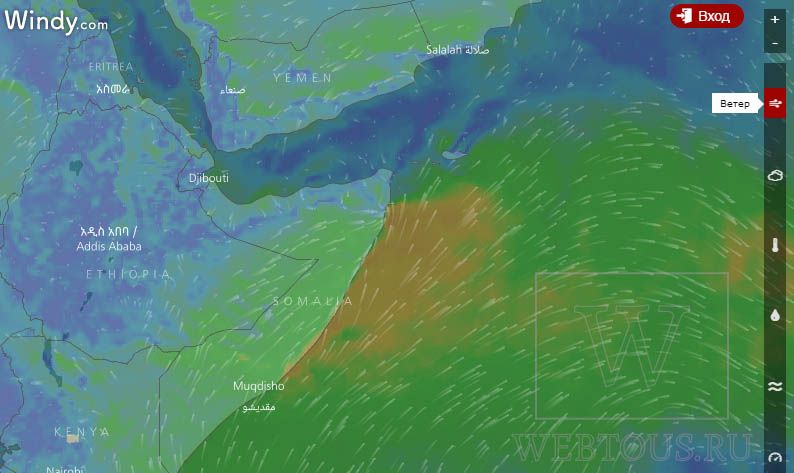
- When we go to the website windy.com, we are greeted with an image of the surface of the globe, on which the movements of the wind are displayed using moving dots.
- As in other similar services, using the mouse wheel we can zoom in or out. Move the map in search of a particular geographical point (by holding down the left mouse button).
- And clicking on the desired place on the map displays the corresponding wind indicator. We can also view the forecast for the next week for this location by clicking on the inscription “Forecast for this location.”

To the right and left of the screen are various settings for using the service. By clicking on the settings button on the left (three horizontal lines), you can decide on various technical settings for the service (use the “weak Internet” mode, set the units of measurement, enable, and so on).

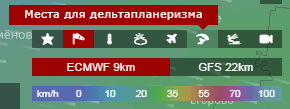
To the right of the screen are switching display modes. You can switch between the modes “Wind”, “Clouds”, “Temperature”, “Rain, Snow”, “Waves”, “Cape Index” (from Convective Available Potential Energy - “Potential energy of convective instability”).
Also below you can select the forecast model that is convenient for you. The resource presents “ECMWF” (“European Center for Medium-Range Weather Forecasts” - European forecasting model) and “GFS” (“Global Forecast System” - American weather forecasting model).

Earth.nullschool.net - allows you to track wind currents
Another service for displaying wind maps in real time that I want to talk about today is the earth.nullschool.net service. Despite the fact that in terms of functionality it is somewhat inferior to the windy.com resource I described. However, this service can also be recommended as a convenient tool for determining wind speed online for almost any point on the globe.
- When we go to this site, we are greeted with images of the globe, on which the direction of the wind is shown by the movement of dots.
- At the bottom left is the service management menu, which is called up by clicking on the inscription “earth”.
- When calling up the menu, I recommend that you immediately click on the “Russian” inscription to switch to the Russian-language interface of the site.

In particular, in the menu settings you can get information:
- both about the past and future state (the “Manage” button);
- switch display modes ("Mode" button);
- set the required display height (Height);
- enable “Overlay”, change a number of other parameters.
Determining the wind indicator for the desired geographical point is done in the standard way: simply move the cursor over the desired location on the map and click the left mouse button.

Conclusion
The services I described allow you to track online the speed and direction of the wind, as well as a number of other weather indicators - temperature, humidity, precipitation, and so on. These services, which display an online wind map in real time, can be recommended to anyone who wants to keep their finger on the pulse of potential weather changes. And of course, the next rain will not be a surprise for you...

 How to make paper dominoes with letters
 Outdoor game owl. Owls, awww! New board game. Outdoor game "Planes"
 Kinetic sand in working with children in a speech therapy group Playing with sand in the work of a speech therapist